Continuous Monitoring Tools for Cloud Environments
Hey there! If you run apps or infrastructure in the cloud, you already know how quickly things can go wrong. One minute everything looks fine, and the next your users are complaining about slow loading or errors popping up. That’s exactly why continuous monitoring tools for cloud environments have become must-haves in 2026.
These tools watch your servers, apps, databases, networks, and even costs 24/7. They collect data on metrics, logs, traces, and security events, then turn it all into clear alerts and dashboards so you can fix problems before they hurt your business.
Whether you use AWS, Azure, Google Cloud, or a mix of all three, the right continuous monitoring tools for cloud environments give you peace of mind and help your team move faster. In this guide, I’ll walk you through everything in simple terms — what these tools are, why they matter right now, the best options for 2026, how to pick one, and real tips to get the most out of them.
Let’s get started.
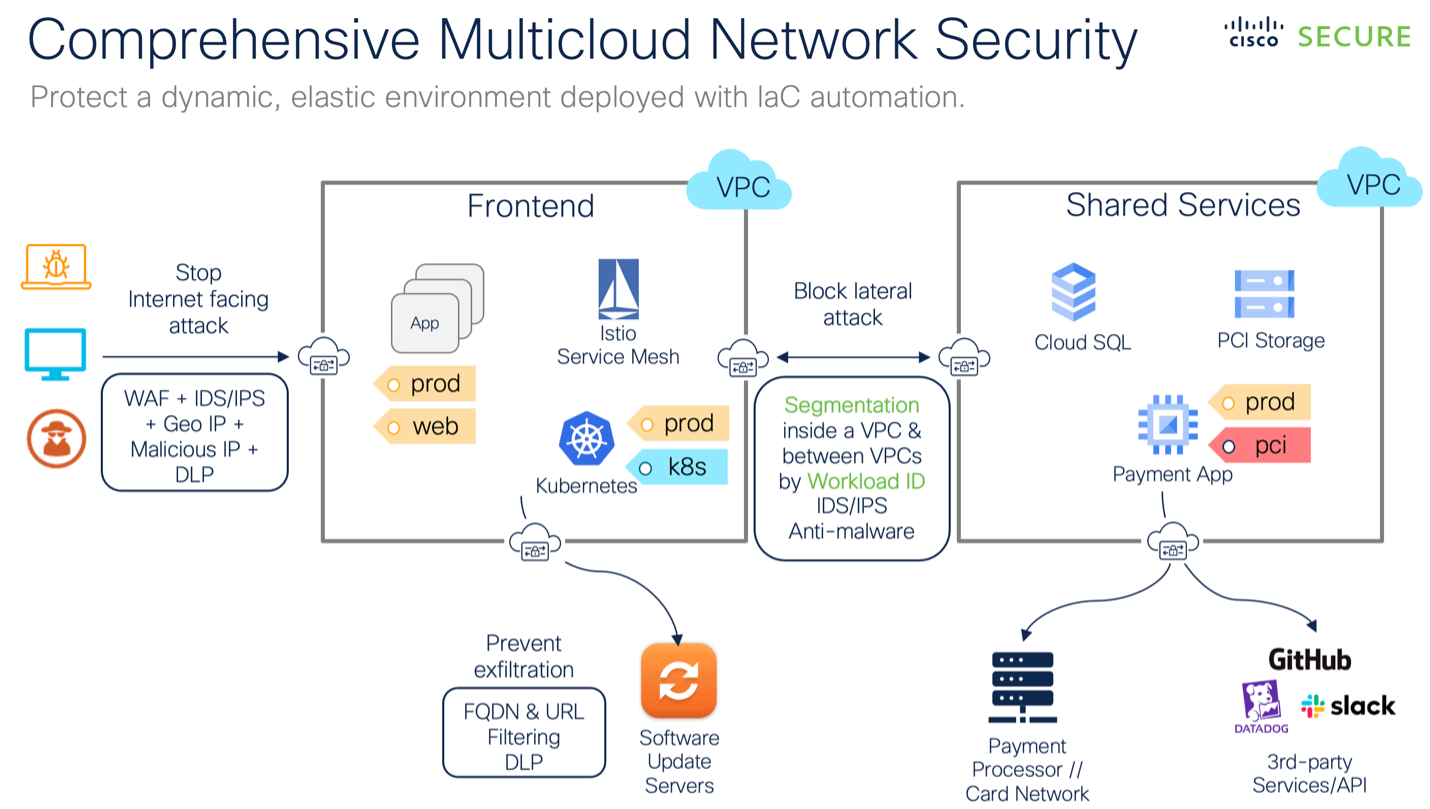
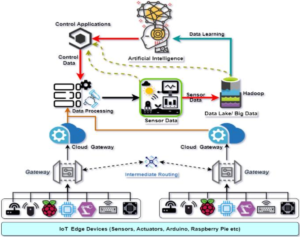
Image: Multi-cloud continuous monitoring architecture diagram (Credit: Cisco via cisco.com)
Why Continuous Monitoring Tools for Cloud Environments Matter More Than Ever in 2026
Cloud setups keep growing more complex every year. Most companies now run workloads across several clouds plus on-prem servers. Add in containers, Kubernetes, serverless functions, and AI models that spin up and down in seconds, and you can see why old-school “check once a day” monitoring just doesn’t cut it anymore.
In 2026, continuous monitoring tools for cloud environments help you:
- Catch issues early – AI spots unusual patterns before users notice.
- Meet compliance rules – Automatic reports for GDPR, HIPAA, SOC 2, and more.
- Control costs – Track spending on storage, compute, and data transfer in real time.
- Improve performance – See exactly which microservice is slowing everything down.
- Speed up recovery – Root-cause analysis that used to take hours now finishes in minutes.
Teams that use good continuous monitoring tools for cloud environments report 40-60% less downtime and happier customers. If your business depends on cloud apps (and whose doesn’t these days?), these tools are like having a super-smart assistant that never sleeps.

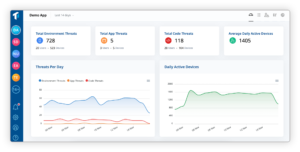
Image: Azure Monitor dashboard example (Credit: Microsoft Learn)
Key Features to Look for in Continuous Monitoring Tools for Cloud Environments in 2026
Not all tools are the same. Here are the must-have features in 2026:
- Full-stack observability – Metrics + logs + traces in one place.
- AI and machine learning – Automatic anomaly detection and smart alerts that learn your normal patterns.
- Multi-cloud and hybrid support – Works the same whether you’re on AWS, Azure, Google Cloud, or your own data center.
- Real-time dashboards – Beautiful, shareable screens that update instantly.
- OpenTelemetry support – So you’re not locked into one vendor.
- Security and compliance monitoring – Continuous checks for misconfigurations and vulnerabilities.
- Cost insights – Shows exactly where your money is going.
- Easy integrations – With Slack, PagerDuty, Jira, GitHub, and your CI/CD pipeline.
If a tool has most of these, it will serve you well for years to come.
Top Continuous Monitoring Tools for Cloud Environments in 2026
Here are the standout options I recommend after looking at real user feedback, features, and pricing in early 2026.
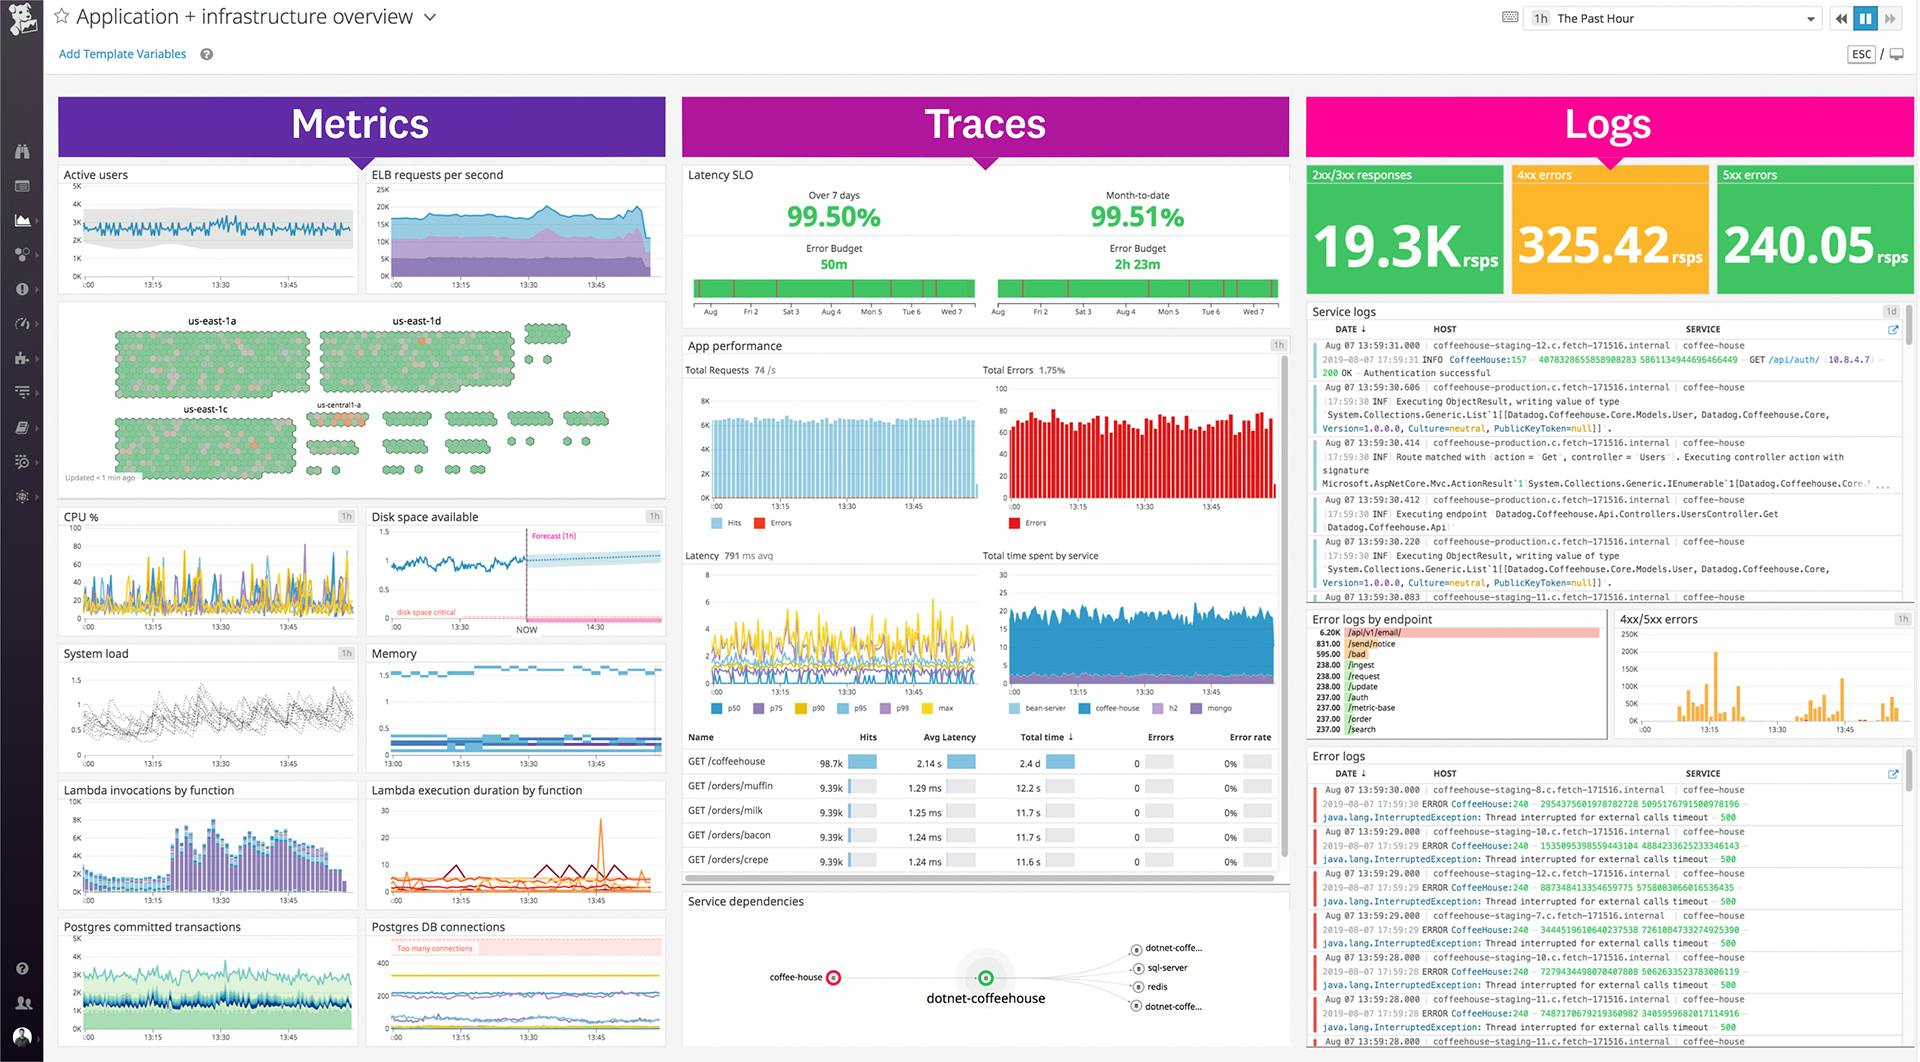
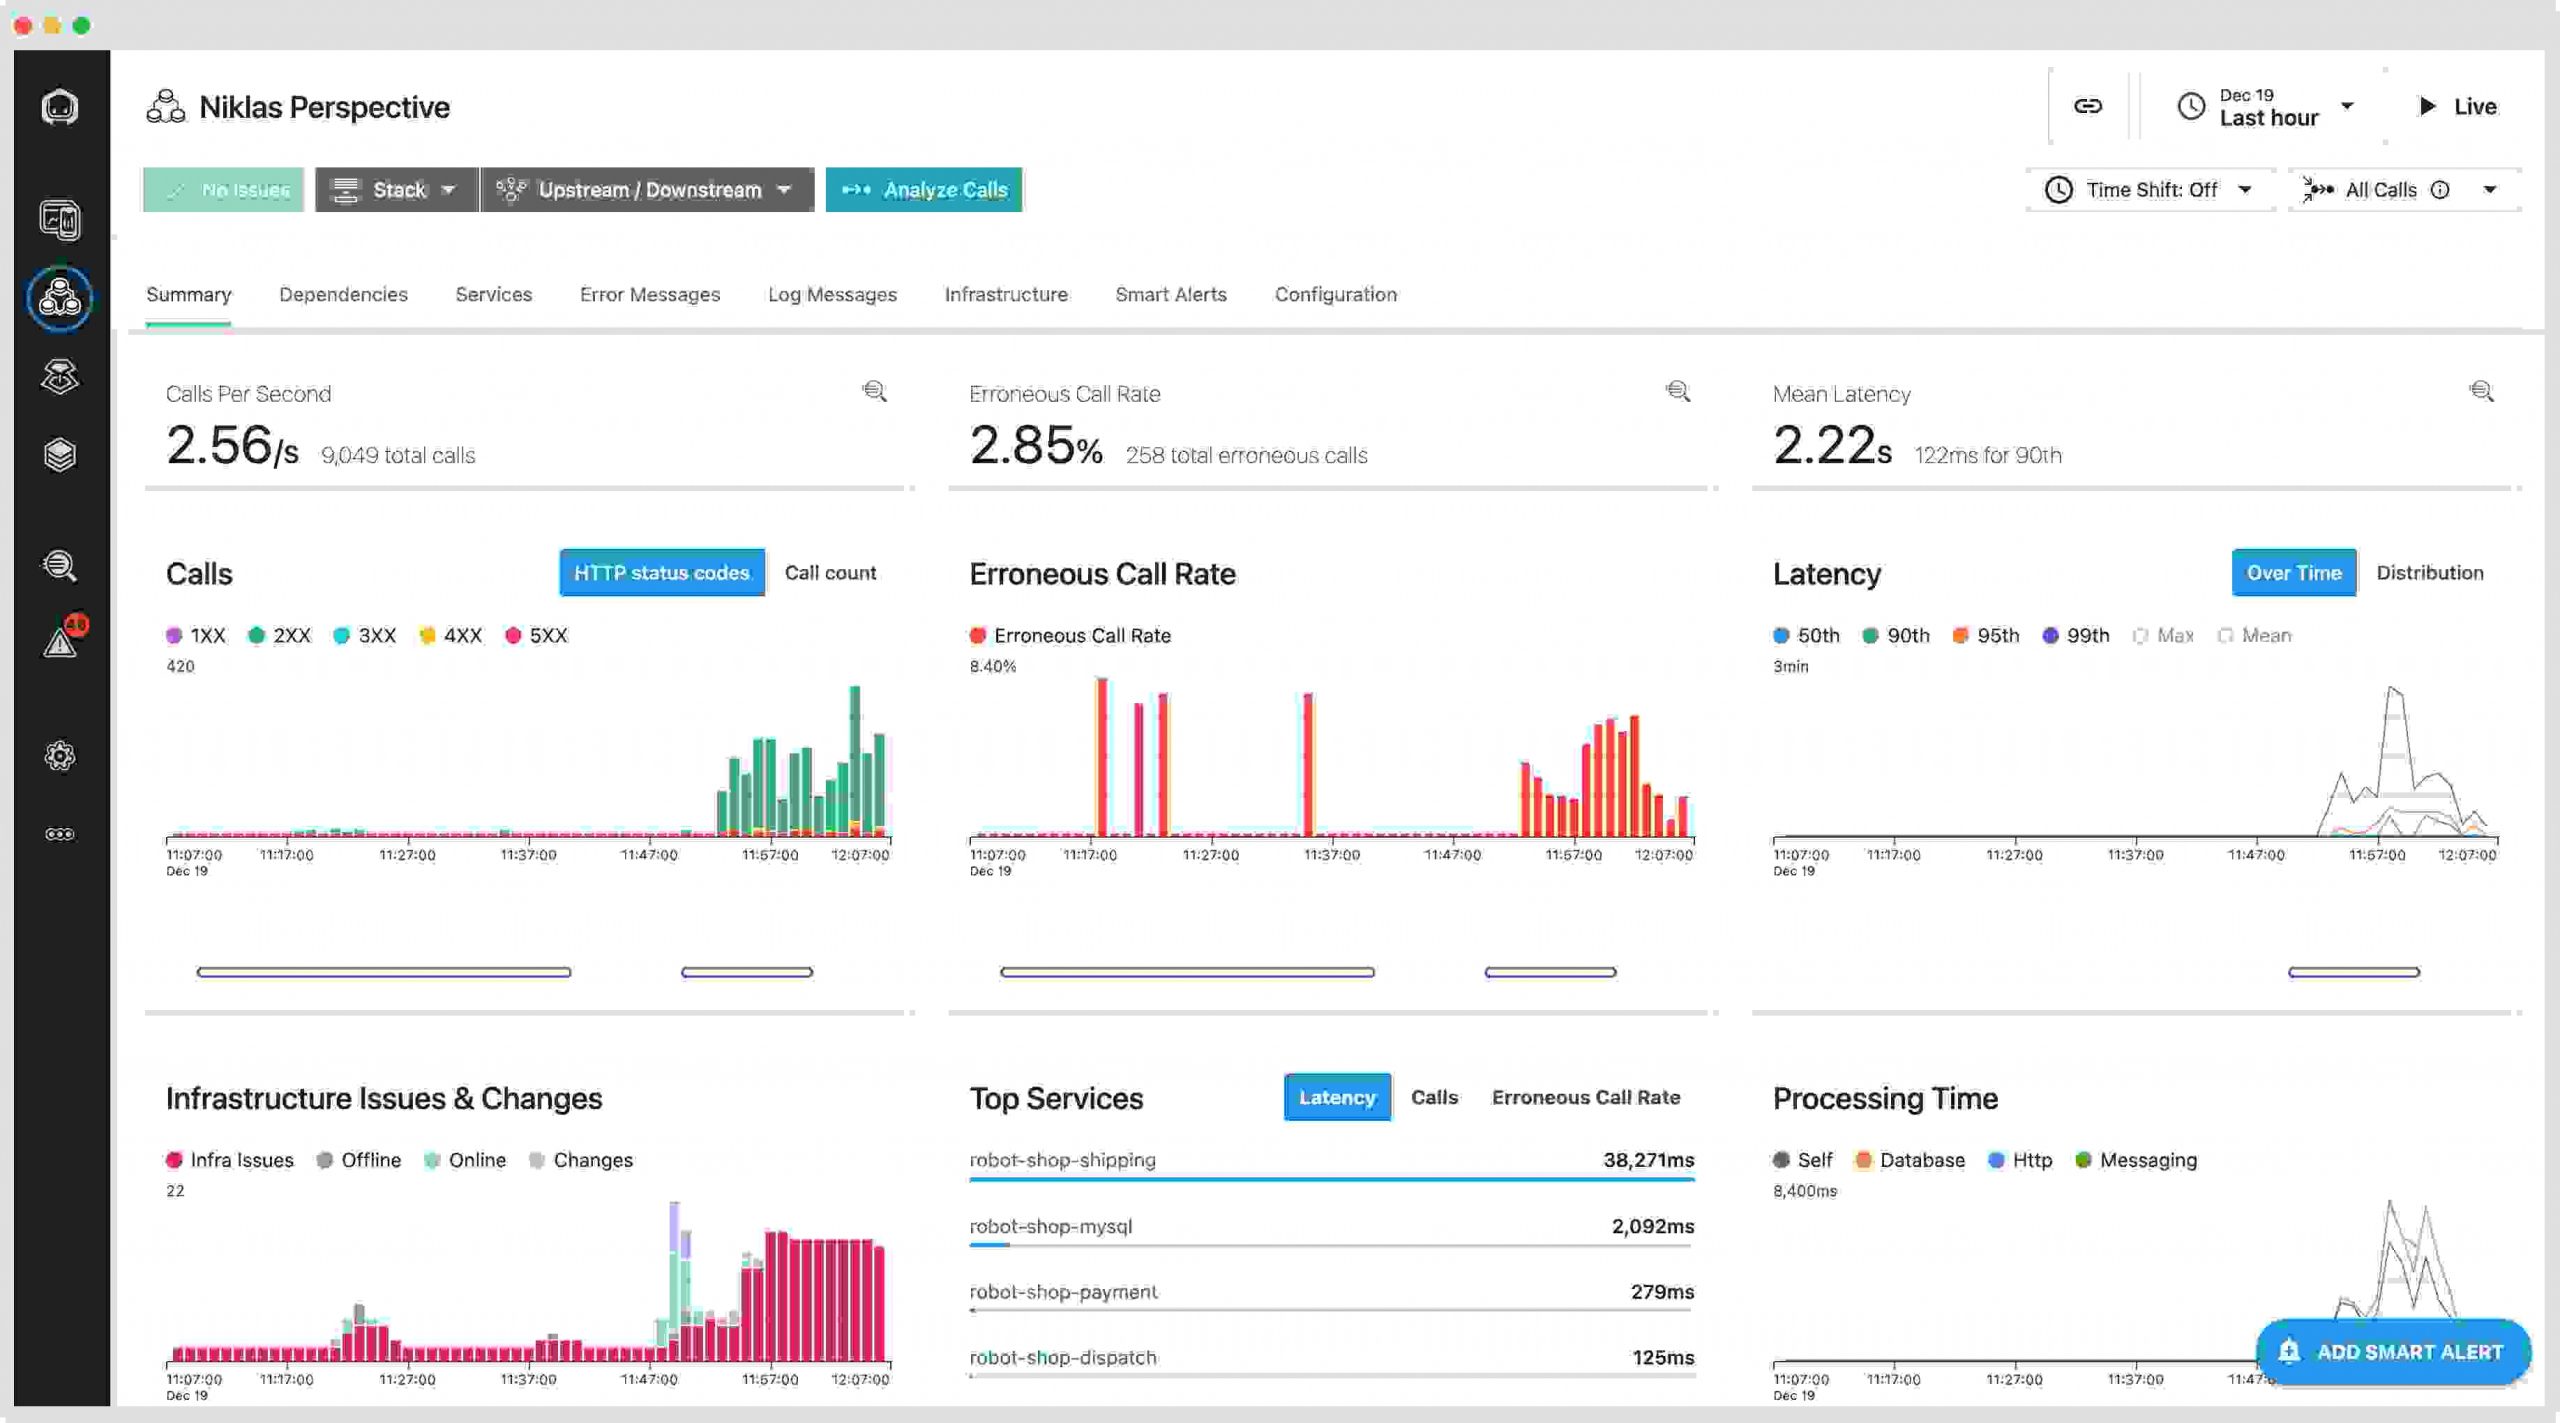
Image: Datadog observability platform dashboard (Credit: Datadog)
1. Datadog – Best All-in-One Continuous Monitoring Tool for Cloud Environments
Datadog tops many lists in 2026 for good reason. It gives you one clean platform for infrastructure, applications, logs, traces, security, and even synthetic monitoring (fake users that test your site).
Key strengths:
- Over 1,000 ready-made integrations.
- Watchdog AI that finds problems automatically.
- Beautiful dashboards that teams actually love using.
- Strong network and container monitoring.
Many mid-size and large teams pick Datadog because it scales easily and the interface feels modern. Pricing starts around $15-20 per host per month but can add up with high log volume — always check the calculator on their site.
Best for: Companies that want everything in one tool and don’t mind investing for great experience.
Learn more: Datadog official site

Image: Dynatrace AI-powered monitoring interface (Credit: Dynatrace)
2. Dynatrace – The AI Champion Among Continuous Monitoring Tools for Cloud Environments
If you want the smartest tool that almost runs itself, look at Dynatrace. Its Davis AI engine does automatic root-cause analysis and even suggests fixes.
Highlights:
- OneAgent installs in minutes and auto-discovers everything.
- Full-stack topology maps that show how services connect.
- Excellent for large enterprises with thousands of hosts.
- Built-in continuous compliance and security posture.
It costs more than some alternatives but saves huge time for big teams. Perfect if your environment is complex with lots of microservices.
Learn more: Dynatrace
3. New Relic – Great for Developers and Full-Stack Teams
New Relic made big improvements in pricing and AI features by 2026. It shines at application performance monitoring (APM) while still covering infrastructure and logs.
Why teams love it:
- Deep code-level insights.
- Usage-based pricing that can be friendlier for variable workloads.
- Strong OpenTelemetry support.
- AI that connects performance to business outcomes.
Ideal for software teams that want to understand exactly how changes in code affect users.
Learn more: New Relic
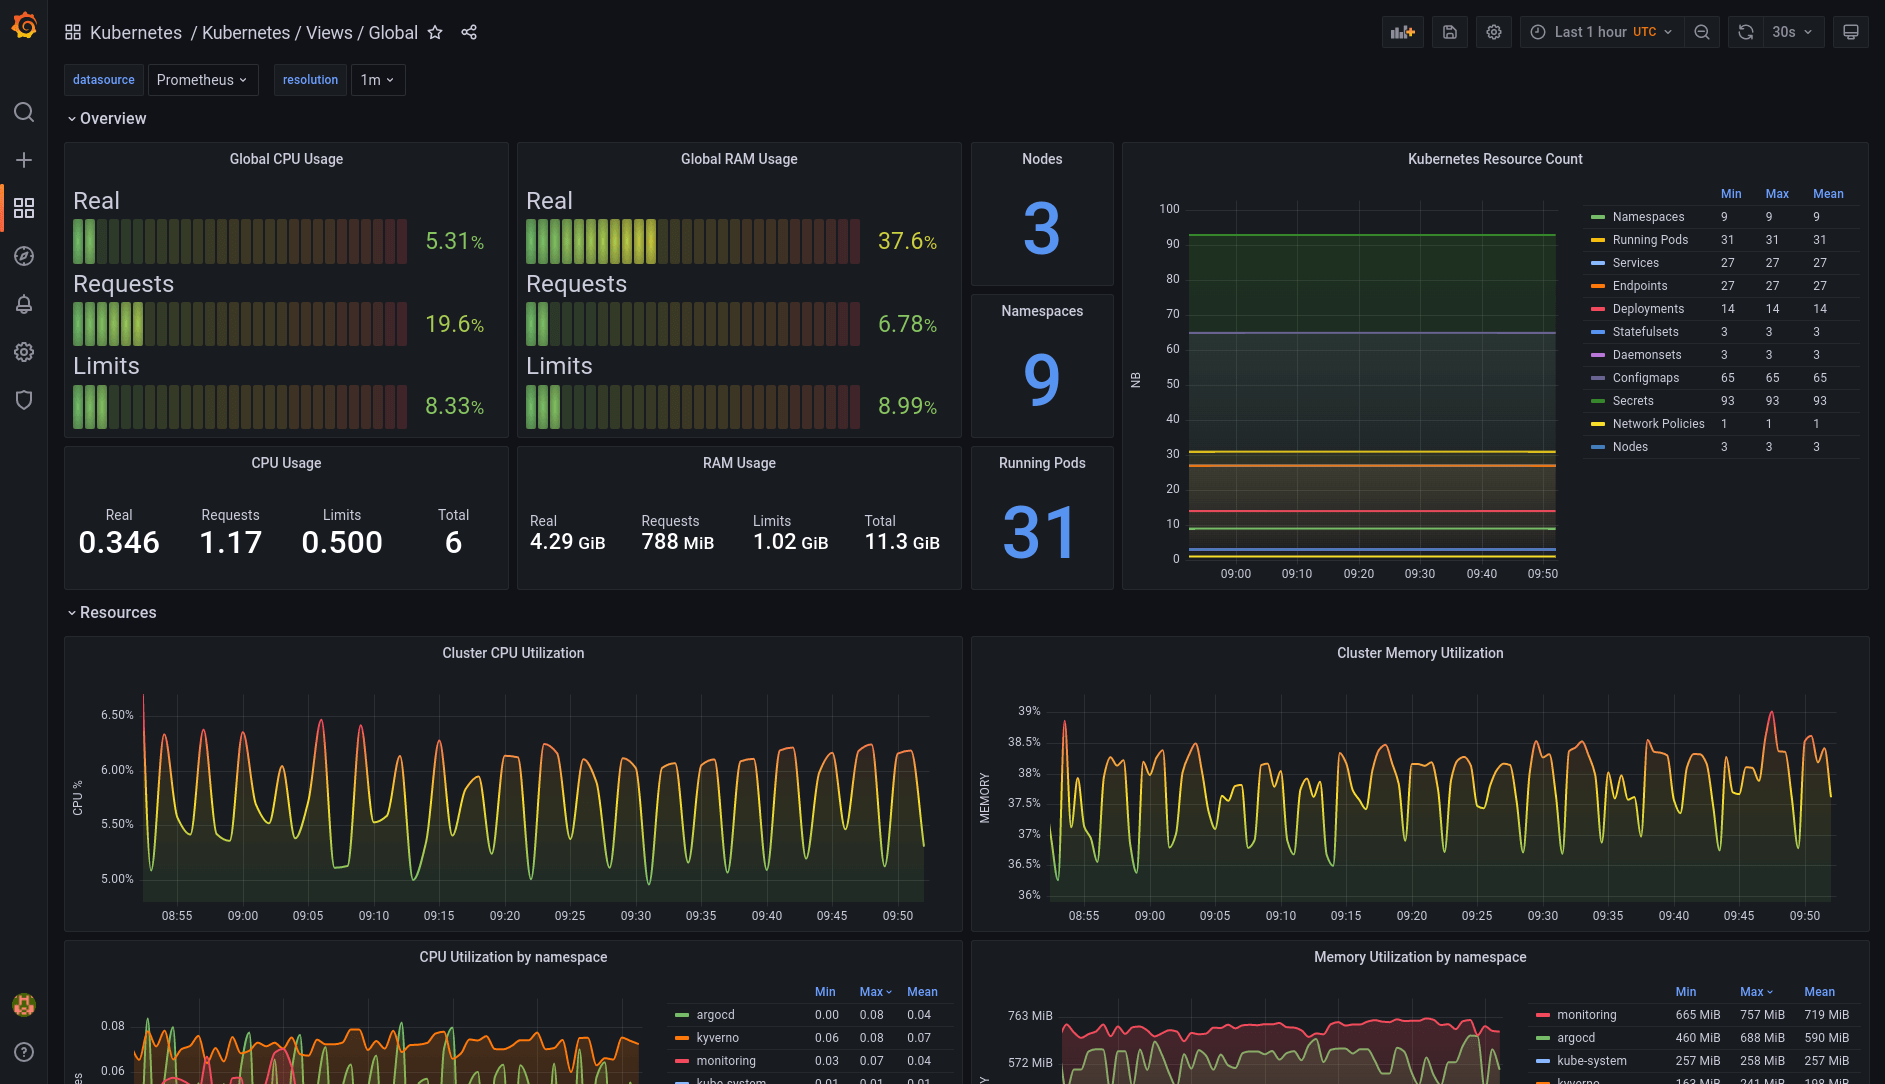
Image: Prometheus + Grafana Kubernetes dashboard (Credit: Grafana Labs)
4. Prometheus + Grafana – Best Open-Source Combo for Continuous Monitoring Tools for Cloud Environments
Don’t want to pay big vendor prices? Prometheus for metrics collection plus Grafana for stunning dashboards is still incredibly popular in 2026.
Pros:
- Completely free to run yourself.
- Huge community and thousands of ready dashboards.
- Works perfectly with Kubernetes.
- Add Thanos or Cortex for long-term storage and multi-cluster views.
Many startups and cost-conscious companies start here and move to managed versions (Grafana Cloud) as they grow.
Learn more: Grafana Cloud
5. AWS CloudWatch – Native Choice for AWS-Heavy Environments
If most of your stuff lives in AWS, CloudWatch is already there and has improved a lot.
What’s new in 2026:
- Better AI anomaly detection.
- Database Insights for RDS and Aurora.
- Unified with X-Ray for traces.
- Container Insights for ECS and EKS.
It’s cheap if you stay within AWS and great for basic-to-advanced needs. Combine with AWS Managed Grafana for nicer visuals.
Learn more: AWS CloudWatch
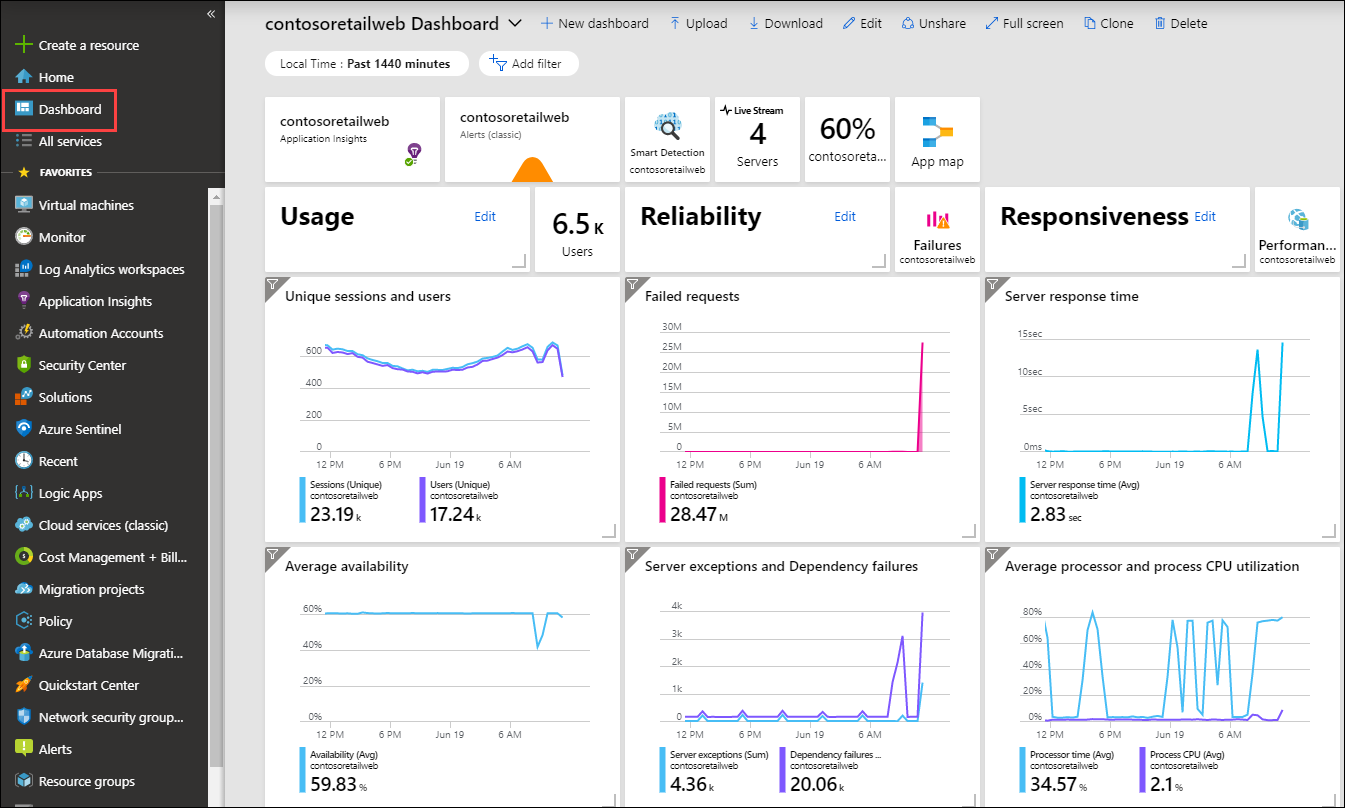
Image: Azure Monitor dashboard (Credit: Microsoft Learn)
6. Azure Monitor – Perfect for Microsoft-Centric Clouds
Azure Monitor (with Log Analytics and Application Insights) gives excellent visibility across Azure services, hybrid setups, and even other clouds via Azure Arc.
Standout features:
- Smart detection and auto-scaling alerts.
- Integration with Microsoft Sentinel for security.
- Workbooks for custom dashboards.
- OpenTelemetry support.
Great pricing for Azure users and seamless with Power BI for reporting.
Learn more: Azure Monitor
7. Elastic Observability – Strong for Log-Heavy Setups
The company behind Elasticsearch now offers a full observability suite that handles massive log volumes like a champ.
Good for:
- Teams that need powerful search across logs.
- Security teams (SIEM features).
- Large-scale Kubernetes environments.
8. Splunk Observability Cloud – Enterprise-Grade Log and Trace Analysis
Still the king for companies that live and breathe logs. In 2026 it added better AI and no-sampling tracing.
Now, let’s compare them quickly.
Quick Comparison of Continuous Monitoring Tools for Cloud Environments (2026)
| Tool | Best For | Pricing Model | AI Features | Multi-Cloud | Ease of Use |
|---|---|---|---|---|---|
| Datadog | All-in-one teams | Per host + usage | Strong | Excellent | Very High |
| Dynatrace | Large enterprises | Per host | Excellent | Excellent | High |
| New Relic | Developer-focused | Usage-based | Good | Good | High |
| Prometheus/Grafana | Cost-conscious & K8s | Free / Cloud paid | Basic (add-ons) | Good | Medium |
| AWS CloudWatch | AWS-only | Pay-per-metric | Good | Limited | Medium |
| Azure Monitor | Microsoft stack | Usage-based | Good | Good | High |
(Internal link: Want a deeper cost comparison? Read our cloud cost optimization guide.)
How to Choose the Right Continuous Monitoring Tools for Cloud Environments
Ask yourself these questions:
- How many clouds do I use?
- Do I need deep application code insights?
- What’s my budget — do I prefer free/open-source or managed?
- How important is automatic AI root-cause analysis?
- Do my compliance teams need built-in reports?
Start small. Many tools offer free trials or generous free tiers. Test with your actual workloads for two weeks before deciding.
Pro tip: Pick a tool that supports OpenTelemetry from day one. It future-proofs you if you ever switch platforms.
Best Practices for Implementing Continuous Monitoring Tools for Cloud Environments
- Start with the basics – Monitor CPU, memory, disk, and key app response times first.
- Set smart alerts – Avoid alert fatigue by using AI-based thresholds.
- Build useful dashboards – One for executives (high-level KPIs), one for SREs (detailed), one for security.
- Integrate with your incident process – Connect to PagerDuty or Opsgenie so alerts create tickets automatically.
- Review weekly – Spend 30 minutes every Monday looking at trends, not just reacting to fires.
- Monitor costs too – Turn on billing alerts so you don’t get surprise bills.
- Train your team – Everyone from developers to managers should know how to read the main dashboard.
Follow these and you’ll see real improvements in reliability within the first month.
Real-World Examples of Continuous Monitoring Tools for Cloud Environments in Action
A mid-size e-commerce company in India moved from manual checks to Datadog. They cut average downtime from 4 hours per month to under 30 minutes and saved $18,000 a year in emergency fixes.
A global bank uses Dynatrace across AWS, Azure, and their private cloud. The AI finds the exact service causing slowdowns during peak trading hours, something their old tools could never do.
A startup running everything on Kubernetes loves Prometheus + Grafana. They keep costs under $200/month while monitoring hundreds of pods.
These stories show that the right continuous monitoring tools for cloud environments deliver results fast.
Future Trends: What’s Next for Continuous Monitoring Tools for Cloud Environments
By late 2026 and into 2027, expect even more “agentic” AI — tools that don’t just alert you but actually fix common problems automatically. Edge monitoring will grow as more workloads run closer to users. And privacy-focused monitoring (without sending raw data outside your region) will become standard for European companies.
The winners will be platforms that stay open, easy to use, and truly intelligent.
Final Thoughts on Continuous Monitoring Tools for Cloud Environments
You don’t need every shiny feature. You need tools that fit your team size, cloud mix, and budget while giving you confidence that everything is running smoothly.
Start by auditing your current setup this week. Pick one or two continuous monitoring tools for cloud environments from the list above, run a proof-of-concept, and measure the difference.
Your future self (and your users) will thank you when the next big traffic spike hits and everything just keeps working.
Have questions about which tool fits your setup best? Drop a comment below or check our other guides on multi-cloud best practices and Kubernetes monitoring tips.
Stay reliable out there!
Share this content:


Post Comment